See also the Executive Summary of “Algorithmic Injustice.”
For generations, the Maasai people of eastern Africa have passed down the story of a tireless old man. He lived alone and his life was not easy. He spent every day in the fields — tilling the land, tending the animals, and gathering water. The work was as necessary as it was exhausting. But the old man considered himself fortunate. He had a good life, and never really gave much thought to what was missing.
One morning the old man was greeted with a pleasant surprise. Standing in his kitchen was a young boy, perhaps seven or eight years old. The old man had never seen him before. The boy smiled but said nothing. The old man looked around. His morning breakfast had already been prepared, just as he liked it. He asked the boy’s name. “Kileken,” the boy replied. After some prodding, the boy explained that, before preparing breakfast, he had completed all of the old man’s work for the day. Incredulous, the old man stepped outside. Indeed, the fields had been tilled, the animals tended, and the water gathered. Astonishment written all over his face, the old man staggered back into the kitchen. “How did this happen? And how can I repay you?” The boy smiled again, this time dismissively. “I will accept no payment. All I ask is that you let me stay with you.” The old man knew better than to look a gift horse in the mouth.
Kileken and the old man soon became inseparable, and the farm grew lush and bountiful as it never had before. The old man could hardly remember what life was like before the arrival of his young comrade. There could be no doubt: With Kileken’s mysterious assistance, the old man was prospering. But he never quite understood why, or how, it had happened.
To an extent we have failed to fully acknowledge, decision-making algorithms have become our society’s collective Kileken. They show up unannounced and where we least expect them, promise and often deliver great things, and quickly come to be seen as indispensable. Their reach can’t be overestimated. They tell traders what stocks to buy and sell, determine how much our car insurance costs, influence which products Amazon shows us and how much we get charged for them, and interpret our Google searches and rank their results.
These algorithms improve the efficiency and accuracy of services we all rely on, create new products we never before could have imagined, relieve people of tedious work, and are an engine of seemingly unbounded economic growth. They also permeate areas of social decision-making that have traditionally been left to direct human judgment, like romantic matchmaking and criminal sentencing. Yet they are largely hidden from view, remain opaque even when we are prompted to examine them, and are rarely subject to the same checks and balances as human decision-makers.
Worse yet, some of these algorithms seem to reflect back to us society’s ugliest prejudices. Last April, for instance, our Facebook feeds — curated by a labyrinth of algorithms — were inundated with stories about FaceApp, a program that applied filters to uploaded photographs so that the user would appear younger or older or more attractive. At first, this app seemed to be just another clever pitch to the Snapchat generation. But things quickly went sideways when users discovered that the app’s “hot” filter — which purported to transform regular Joes and Jills into beautiful Adonises and Aphrodites — made skin lighter, eyes rounder, and noses smaller. The app appeared to be equating physical attractiveness with European facial features. The backlash was swift, ruthless, and seemingly well-deserved. The app — and, it followed, the algorithm it depended on — appeared to be racist. The company first renamed the “hot” filter to “exclude any positive connotation associated with it,” before unceremoniously pulling it from the app altogether.
FaceApp’s hot filter was far from the first algorithm to be accused of racism, and certainly won’t be the last. Google’s autocomplete feature — which relies on an algorithm that scans other users’ previous searches to try to guess your query — is regularly chastised for shining a spotlight on racist, sexist, and other regressive sentiments that would otherwise remain tucked away in the darkest corners of the Internet and our psyches.
But while rogue apps or discomfiting autocomplete suggestions are both ephemeral and potentially responsive to public outcry, the same can hardly be said about the insidious encroachment of decision-making algorithms into the workings of our legal system, where they frequently play a critical role in determining the fates of defendants — and, like FaceApp, often exhibit a preference for white subjects. But the problem is more than skin deep. The issue is that we cannot escape the long arm of America’s history of racial discrimination just by writing an algorithm. The question is whether fairness requires more than simply crunching the numbers.
An algorithm is, in its most basic form, a well-defined procedure for solving a problem or making a decision. In this sense, the use of algorithms in the judicial system long predates not only the Big Data era but even the widespread integration of computers into our workplaces. The U.S. Federal Sentencing Guidelines — a manual of rules for helping judges efficiently determine fair sentences — are essentially a set of hyper-detailed algorithms meant to simplify and standardize judicial sentencing. And just as we’ve progressed from printing the original 1987 guidelines in bound volumes to making them easily accessible online, so too have we begun to employ computers to guide judicial choices using more advanced, software-based algorithms.
But the rough continuity between the earlier guidelines and computerized algorithms shouldn’t obscure just how much we as a society have in recent years ceded judicial agency to algorithms. Unlike the earlier guidelines, not only are the new algorithms executed by a computer rather than a person, but in many cases their workings are likely too abstruse to be understood, much less fairly administered, by a judge.
Courts across America have adopted a patchwork of different algorithms for a wide variety of tasks, and as a result there is no single algorithmic system that’s as ubiquitous as the Federal Sentencing Guidelines. One of the more prominent ones, however, is the Correctional Offender Management Profiling for Alternative Sanctions system, a mouthful that condenses into the catchier acronym, COMPAS. It was first developed in 1998 by the for-profit consulting company Northpointe Institute for Public Management (recently rebranded as part of Equivant, a software company based in Ohio).
Northpointe’s aim was to develop a product that made accurate judgments on a defendant’s risk of recidivism, or re-offending. Often, judges use the risk scores produced by these algorithms to determine whether a person awaiting trial should be sent to jail or released, and whether or not a person convicted of a crime should be sentenced to prison, granted parole, or given the opportunity to receive the help he might need to get his life back on track.
Reporting differs on the extent to which judges can or do use the risk scores as a factor in determining the actual length of a prison sentence. The creators of risk assessment algorithms have been quoted in news articles insisting that their systems are intended only to suggest which defendants might be most eligible for alternatives to incarceration. The Assistant Attorney General for the state of Wisconsin, offering a more ambiguous picture, argued before the state Supreme Court that “the risk score alone should not determine the sentence of an offender.” Yet, judges have repeatedly cited high risk scores in their sentencing decisions, and admitted to reporters that they gave longer sentences than they would have had they not known the score.
COMPAS works by evaluating a range of factors including age, sex, personality traits, measures of social isolation, prior criminal history, family criminality, geography, and employment status. Northpointe gets some of this information from criminal records, and the rest from a questionnaire that asks defendants to respond to queries like, “How many of your friends/acquaintances are taking drugs illegally?” and to agree or disagree with statements like, “A hungry person has a right to steal.” Northpointe’s belief that they could improve on the performance of judges was based on the idea that, without the benefit of algorithmic assistance, even experienced jurists would make less consistent, more personal, and perhaps more biased evaluations as to the likelihood of re-offense.
It’s hard to know for sure whether Northpointe succeeded. Its researchers published a study in 2008 estimating the algorithm’s predictive accuracy to be 68 percent. Assuming this figure is correct, nobody — including Northpointe — can clearly say whether it’s good or bad or somewhere in between. Without context, the number is a cipher. Part of the issue stems from the word “accuracy” having different — and often contradictory — meanings in a statistical context and in everyday usage. The rest can be pinned on how easily our immediate intuitions can betray us when we try to interpret statistics. So rather than trusting our gut, it’s worth taking a moment to explore how COMPAS works and how to make sense of this 68 percent accuracy rating.
COMPAS does not offer a simple yes-or-no prediction as to whether someone will recidivate. Instead, for each criminal facing sentencing, COMPAS calculates a score, measured on a scale of 1 (lowest) to 10 (highest), describing the risk that he will re-offend. Re-offending is defined as committing “a new misdemeanor or felony offense within two years of the COMPAS administration date.”
As it happens, there are many different ways to measure the predictive usefulness of this kind of test (the table “Measurements of Predictive Reliability” below offers an overview). Did people with high risk scores re-offend more often than people with low risk scores? Of the people who did not re-offend, were more of them rated low-risk than high-risk? The list goes on and on.
COMPAS uses a statistical metric known as the concordance index that encompasses all of these considerations. The concordance index measures the odds that any reoffender’s risk score is higher than any non-reoffender’s risk score. For COMPAS, the odds are 68 percent. (This measurement is statistically equivalent to the standard of accuracy, which measures the overall correctness of a test that issues only two ratings, high-risk and low-risk. Northpointe researchers largely use the two terms interchangeably, and this article will too.)
Making sense of what level of predictive accuracy counts as good, particularly in criminal sentencing, is far from straightforward. For starters, the minimum standard to beat is not 0 percent — which would mean that the predictions were always wrong — but 50 percent. This is the accuracy you’d expect to achieve if you assigned defendants’ risk scores randomly, because the odds that a reoffender’s risk score will be higher than a non-reoffender’s risk score will be the same as a coin toss. So one way to look at COMPAS’s accuracy level of 68 percent is that it’s significantly better than a random guess. But it’s also closer to a random guess than to a perfect prediction.
The Northpointe study’s authors explain that “a rule of thumb according to several recent articles” is that predictive accuracy of at least 70 percent is typically “satisfactory.” This level derives from many fields in which predictive measures are used, including medicine. While COMPAS did not meet this general standard overall, it’s in the ballpark. And for several specific types of predictions it actually exceeded that standard — for example, it achieved 80 percent accuracy in predicting whether women would go on to commit a personal offense (such as murder or assault).
But the important question should be why this — or any — “rule of thumb” ought to qualify as acceptable for criminal sentencing. The Northpointe study offers nothing aside from convention as a rationale for the 70-percent standard. It does not, for example, compare COMPAS to the accuracy of judges without algorithmic assistance. Rather than such a favorable comparison, or some independent criteria of justice, the 70-percent rule of thumb seems to be derived in reverse: Acceptable performance is whatever predictive measures are able to achieve.
Despite its questionable reliability, COMPAS has become one of the most widely used tools for assisting in judicial decision-making in America. This has made it a lightning rod for criticism — with the New York Times, for example, publishing a number of critical articles in the last few years. Still, despite the firestorm, the inner workings of the COMPAS algorithm, like those of its competitors, remain a fiercely guarded secret.
Attempting to find a way around COMPAS’s opacity, the investigative journalism group ProPublica recently conducted its own independent analysis. Through an open records request, ProPublica was able to obtain the COMPAS risk evaluations for 18,610 defendants who were scored in Broward County, Florida in 2013 and 2014. They then published their own analysis of the data in a widely discussed May 2016 article titled “Machine Bias.”
In ProPublica’s view, the results were less than encouraging. They found that “of those deemed likely to re-offend” — which ProPublica defined as an overall risk score of 5 or higher — “61 percent were arrested for any subsequent crimes within two years.”[1] They describe this result as “somewhat more accurate than a coin flip.” But ProPublica also found that “only 20 percent of the people predicted to commit violent crimes” — a risk score of 5 or higher specifically for violent crime — “actually went on to do so.” They deemed this result “remarkably unreliable.”
The headline criticism of ProPublica’s investigation, however, was not about COMPAS’s overall reliability but that its risk scores were racially biased. While black subjects were about equally distributed across the risk scores, white subjects were much more likely to be deemed “low-risk.” The black defendants did in fact have higher recidivism rates, but when ProPublica used statistical controls to adjust for the different recidivism rates, as well as for age, gender, and number of prior crimes, black defendants were still 45 percent more likely to be deemed “high-risk” than their similar white counterparts.
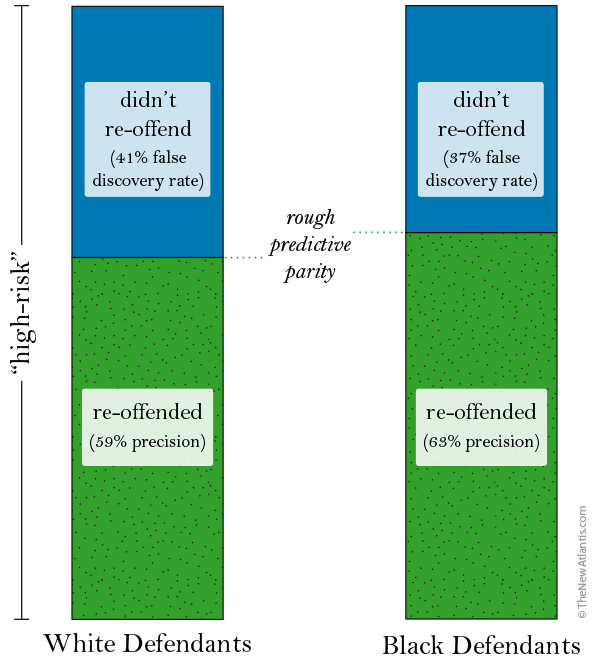
Predictive Precision
Outcomes for Defendants Labeled “High-Risk”
False Positive Rates
Risk Labels for Defendants Who Did Not Re-offend
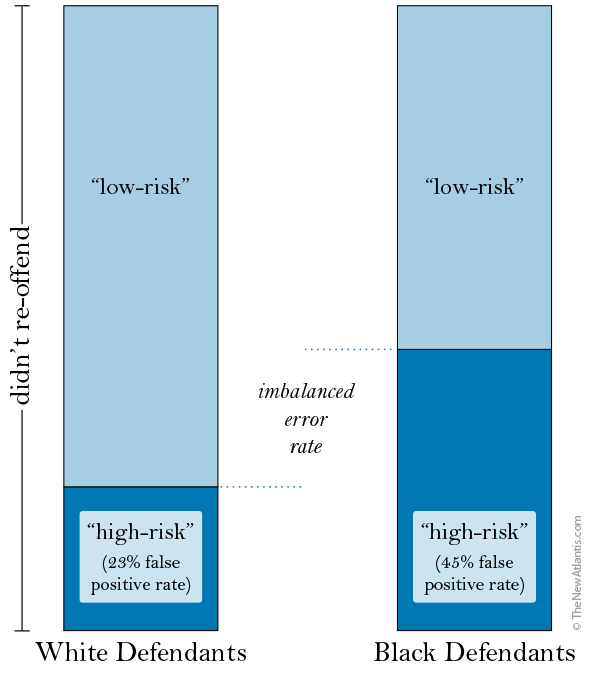
Adding insult to injury, ProPublica found that COMPAS’s mistakes were also biased against black defendants. Among the people COMPAS labeled “high-risk,” the share who did in fact re-offend was only slightly higher for black subjects than for whites (see the figure “Predictive Precision” at right top). Some of the error rates, however, heavily disfavored the black subjects. Of those who did not go on to re-offend, the share who had mistakenly been labeled “high-risk” was nearly twice as high for black subjects as for whites (see the figure “False Positive Rates” at right bottom). From the other side, of the subjects who did re-offend, the share who had mistakenly been labeled “low-risk” was 48 percent for white subjects compared to just 28 percent for black subjects.
In other words, COMPAS was mistakenly lenient to white subjects about twice as often as to blacks, and mistakenly harsh to blacks about twice as often as to whites. The data seem to tell a tidy story: COMPAS has a tendency — despite its questionnaire ostensibly excluding race from consideration — to systematically give more unfavorable judgments to black defendants.
For added effect, the ProPublica authors’ statistical analyses were interwoven with a number of stories contrasting two people, always one black and one white, who had been convicted of similar crimes but were assigned very different COMPAS scores. Each time, the black defendant was deemed “high-risk” but did not re-offend, while the white defendant was deemed “low-risk” but did re-offend. There is not a lot of room to draw any conclusion besides the COMPAS algorithm being racially biased. It’s a compelling piece of journalism.
But, seen another way, the ProPublica piece can be read not as an indictment of COMPAS and other such tools as racist, but instead as an illustration of the daunting complexities inherent in applying our intuitive sense of justice to making fair statistical predictions. As we will see, it may even be impossible to fully satisfy our sense of justice when race enters the equation — at least in a society like ours, with a long history of racial discrimination.
Northpointe, as you might expect, offered a vehement rejoinder to ProPublica’s analysis, which ProPublica in turn rebutted point by point. Numerous academic papers have also since been published on the subject. On close scrutiny, both Northpointe’s defense of its own system and a good deal of ProPublica’s criticism turn out to be questionable.
The devil is in the details. As we will repeatedly encounter, much of the dispute arises from the fact that there are many different ways to measure predictive reliability and error, several of which can easily be confused with one another.
For example, suppose we want to know how often COMPAS incorrectly judges defendants too harshly. One way we might measure mistaken harshness is in terms of how frequently people who are labeled “high-risk” did not go on to re-offend. This is known as the false discovery rate. Alternatively, we can measure mistaken harshness in terms of how often people who didn’t re-offend had been labeled “high-risk.” This is the false positive rate.
These are similar-sounding but different concepts, and even if one rate is the same for white and black defendants, the other might be quite different. In their exchanges, Northpointe and ProPublica sometimes fail to specify which measurement of reliability they’re referring to, or use the wrong term or an unclear description. To help avoid these kinds of confusion, I’ve included two tables with an overview of different measurements of predictive reliability and error.
Measurements of Predictive Reliability
| Applies to risk‑rating type | Type of reliability | Measures the likelihood that… | → | Better-than-random guess must have reliability above | |
|---|---|---|---|---|---|
| Accuracy | “high‑risk” vs. “low‑risk” | Correctness of all predictions | Any defendant |
Is predicted correctly | 50% |
| Concordance index | 1‑to‑10 risk scores | Relative correctness of risk ratings | Any reoffender’s risk score | Is higher than any non-reoffender’s risk score | 50% |
| Precision | “high‑risk” vs. “low‑risk” | Correctness of predictions of re‑offense | A defendant labeled “high‑risk” | Re‑offends | The overall re‑offense rate |
Measurements of Prediction Error
| Type of mistake | Measures the likelihood that a defendant who… | → | Complementary correctness rate (the two always add to 100%) | |
|---|---|---|---|---|
| False positive rate | Mistaken harshness | Doesn’t re‑offend | Was labeled “high‑risk” | Specificity |
| False discovery rate | Mistaken harshness | Is labeled “high‑risk” | Doesn’t re‑offend | Precision |
| False negative rate | Mistaken leniency | Re‑offends | Was labeled “low‑risk” | Sensitivity |
A related problem is that the standards for what counts as good reliability differ from one measurement to the next. The standard of accuracy mentioned before refers to the algorithm’s overall correctness, and so incorporates both the high-risk and low-risk predictions. In this case, ProPublica’s comparison to the accuracy of a coin flip is appropriate. (ProPublica’s own estimate pins COMPAS’s overall accuracy at 66 percent — not too far off from Northpointe’s claim of 68 percent.)
But there are many ways to judge the reliability of a predictive system, each of which tells a different, and often conflicting, story. If we look instead just at the people who were predicted to re-offend, the standard to beat shouldn’t be a coin flip, but instead however often people actually do re-offend. If, say, 60 percent of the overall population went on to re-offend, the “high-risk” population would need to re-offend significantly more than 60 percent of the time to consider the algorithm better than a random guess. This isn’t a question of “accuracy” — the word ProPublica confusingly uses — but what statisticians call precision.
With that in mind, let’s look at how the COMPAS predictions that ProPublica analyzed compared to the actual recidivism rates: The 61 percent re-offense rate among “high-risk” defendants compared to a 45 percent re-offense rate among all defendants, and the 20 percent rate of new violent crimes among “violent high-risk” defendants compared to an 11 percent rate among all defendants.[2] In other words, a person deemed generally high-risk was a third more likely than the overall group to actually commit another offense, and a person deemed violently high-risk was almost twice as likely as the overall group to commit a violent offense. Quantitatively and qualitatively, this feels very different than saying the algorithm has an accuracy of 68 percent.
But the central problem persists: None of these analyses say much of anything about what counts as a just level of predictive accuracy. Even if 20 percent predictive precision is better than a random guess, we may still have good reason to reject it as simply too low to justly use in determining someone’s fate. We are asking statistics to meet competing standards of justice while relying on murky intuitions of what those standards are, and without asking whether it is even possible to meet them all at once.
The beating heart of the controversy is a mathematical conundrum about fairness that, in spite of valiant attempts by both academics and the news media, can’t be easily explained.
Fairness, of course, is not a concept intrinsic to statistics. And, likewise, it’s not easy to transcribe ethical ideas into scientific terms. Carnegie Mellon statistics professor Alexandra Chouldechova has helpfully highlighted the problem by offering several definitions of fairness in an incisive 2017 paper on the COMPAS controversy. By one reckoning, Chouldechova points out, we might conclude that fairness requires that, among those who are labeled “high-risk,” black defendants and white defendants will go on to re-offend at the same rates. This would mean that prediction has the same precision regardless of race, and that we’ve achieved a standard of fairness known as predictive parity. COMPAS, to its credit, comes reasonably close to clearing this bar (see the figure “Predictive Precision”).
Conversely, we might say that for an algorithm to be fair, it should make mistakes at the same rate regardless of race. That is, it should produce the same rates of mistaken leniency (or false negative rate) and mistaken harshness (false positive rate) for black subjects as for white subjects. This standard of fairness is known as error rate balance — and COMPAS falls well short of it (see the figure “False Positive Rates”).
Recidivism Rates
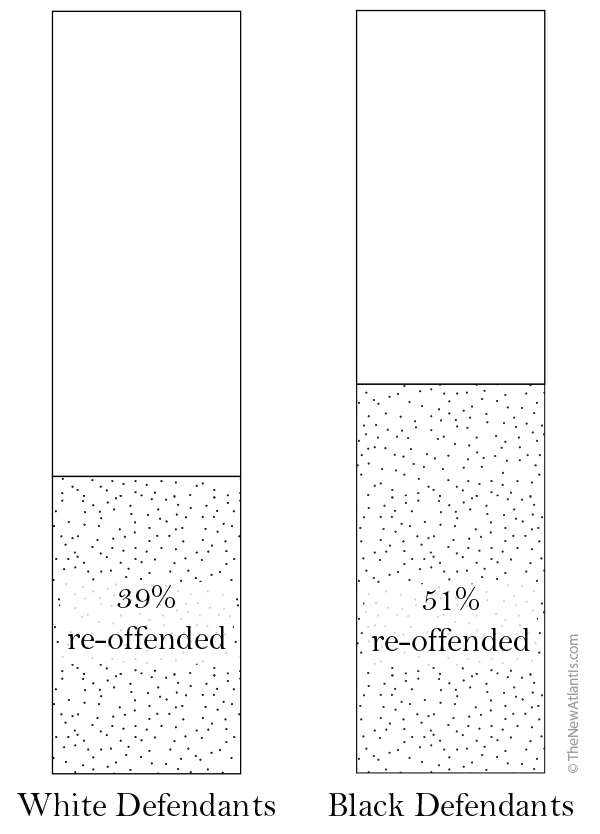
The trouble is that measurements of predictive reliability and fairness don’t exist in a vacuum. They are mathematically linked to how frequently the event you’re trying to predict actually occurs — what statisticians call the base rate of the event. If recidivism is more prevalent among black defendants than whites, it seems reasonable to think that a higher proportion of black defendants might be accurately labeled “high-risk.” And indeed, in the sample analyzed by ProPublica, the rate of recidivism was higher for black defendants than for white defendants (see the figure “Recidivism Rates” at right).
This is problematic because our two measures of fairness happen to be negatively correlated. That is, when dealing with two populations with different recidivism rates, better fairness in one sense (predictive parity) can only be achieved by reducing fairness in the other sense (error rate balance), and vice versa. The price of any attempt to balance predictive parity or error rates is increased unfairness in the other direction. It’s like an especially high-stakes game of whack-a-mole.
Since we know which defendants from the ProPublica sample actually went on to re-offend, we can also consider the problem in terms of how to fairly draw defendants with high risk scores from the pools of reoffenders and non-reoffenders. The figure “Risk Assignment” (below; larger version here), which brings together the previous three figures, helps us visualize the problem. It shows how the “high-risk” assignments (a risk score of 5 or higher) are drawn out of the overall black and white populations. To simplify things, it imagines that each population has 100 defendants.
Risk Assignment
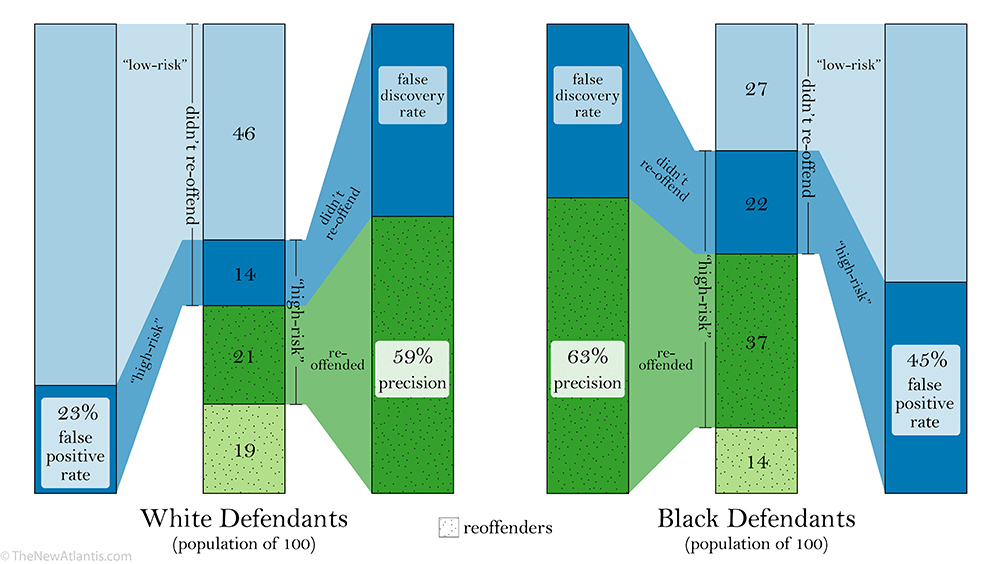
When COMPAS labels defendants as “high-risk,” it will correctly draw many of them (colored in dark green) from the pools who will go on to re-offend. The figure shows that the share of “high-risk” defendants who are correctly pulled from the recidivists is about the same for blacks (63 percent) as for whites (59 percent). These rates, again, are the test’s precision. So far, so good.
But since the algorithm is imperfect, it will also mistakenly draw some “high-risk” offenders from the pool of those who won’t re-offend. Since we’re keeping the precision rates roughly the same, and more “high-risk” black than white defendants were drawn from the reoffenders (dark green), proportionately more blacks will also be drawn mistakenly from the non-reoffenders (colored in dark blue). And, don’t forget, there were fewer non-reoffending black defendants to begin with. Ultimately, because of the different recidivism rates, after the “high-risk” assignments are made there will be a scarcity of non-reoffending blacks remaining to be correctly labeled as “low-risk” (colored in light blue).
The takeaway is that, of all the non-reoffenders, a much larger share of black subjects will be mistakenly labeled as “high-risk,” which is the same as saying that there will be many more false positives among the black cohort. When there is a difference in the recidivism rate, having racial equality in the correctness of the “high-risk” assignments — having equal precision — guarantees you will have unequal false positive rates.
Risk Assignment – Adjusted for Fair False Positive Rates
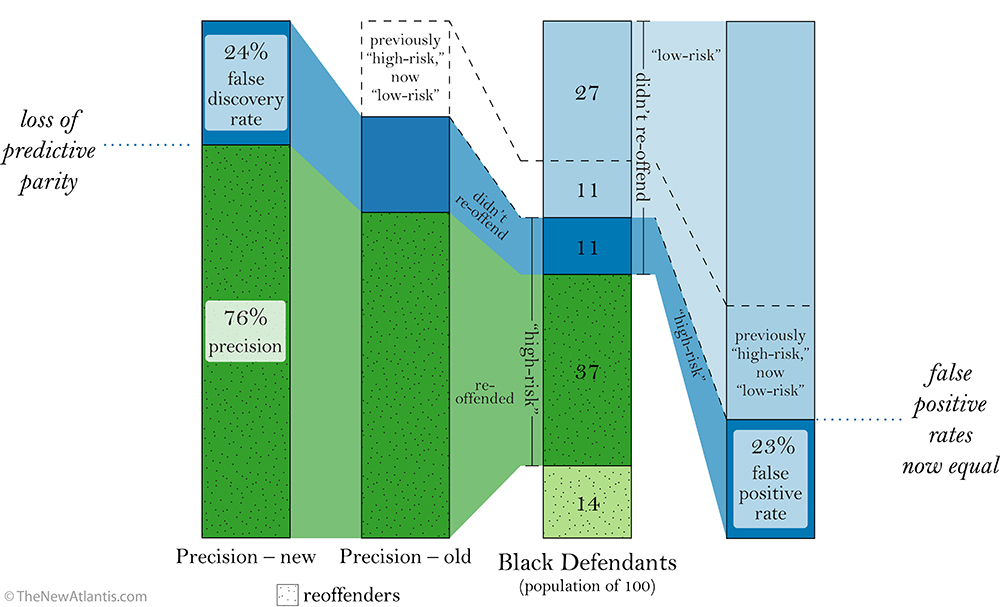
This conundrum applies in the opposite direction, too. If we correct the mistaken “high-risk” assignments for 11 of the black defendants,[3] then the data will yield equal false positive rates for both races. This change is shown in the figure “Risk Assignment – Adjusted for Fair False Positive Rates” (above; larger version here). As we can see in the “Precision – old” section of the figure, the number of black defendants labeled “high-risk” correctly (dark green) hasn’t changed, but the number labeled “high-risk” mistakenly (dark blue) has shrunk. So now relatively more “high-risk” assignments are correct — meaning the precision has increased (see “Precision – new”).
On first glance, this adjustment would seem to be a boon for fairness: Of the defendants who don’t re-offend, the same share of black and white defendants (23 percent) will now be mistakenly labeled “high-risk.” But we’ve also unwittingly introduced a new kind of unfairness: The algorithm is now significantly less precise for white defendants than for black defendants.
It’s probably simpler to talk about this new unfairness in terms of the false discovery rate. The precision and the false discovery rate of a test always add up to 100 percent, which means that they are equivalent ways of describing predictive parity. Again, the false discovery rate is easy to confuse with the false positive rate, since both measure mistaken harshness, but they are different concepts.
Before the adjustment, the false discovery rates were about equal between the races (41 percent for whites, 37 percent for blacks) while the false positive rates were highly unequal (23 percent for whites, 45 percent for blacks). Now, after the adjustment, the false positive rates have been equalized — but the false discovery rates have become unequal (41 percent for whites, 24 percent for blacks). So by achieving equivalent levels of harshness by one definition, we’ve sacrificed equity in another.[4] There’s always another mole to be whacked.
| Same rates for white and black defendants of | … determined by equal | … or, equivalently, by equal | Focused on by | |
|---|---|---|---|---|
| Predictive parity | Correctness of “high‑risk” predictions | Precision | False discovery rates | Northpointe (Equivant) |
| Error rate balance | Correctness of all predictions | False positive rates and false negative rates |
Specificity and sensitivity | ProPublica |
The bottom line is that the algorithm can satisfy at least one measure of fairness, but it cannot satisfy every measure of fairness all at once. This limitation means that ProPublica can strenuously object to COMPAS’s poor error rate balance, while Northpointe can tout its relatively strong predictive parity, and both can be correct (see the table “Different Definitions of Fairness”). What goes unsaid is that they’re talking past each other, apparently blind to the maxim that when inequality is fed into a prediction, it will always come out somewhere or another. You can shuffle it around but you can’t eliminate it. As long as the recidivism rates differ between the races, one or the other will be judged unfairly. This is the fairness paradox. And seen through its lens, COMPAS’s errors are less the product of a nefarious scheme than a mathematical inevitability.
Another way of assessing fairness is by looking at the data that’s fed into the algorithm and how it relates to race. But even with this approach, a straightforward definition of fairness remains elusive. Roughly speaking, there are three distinct classifications for the data used in a criminal sentencing algorithm. It can be race-related, meaning it explicitly refers to the subject’s race. It can be race-neutral, meaning it has no correlation with race at all. Or it can be a race proxy, meaning that while it doesn’t explicitly refer to race, it does correlate with race — examples include ZIP code, socioeconomic status, and previous arrests. Typically, risk-assessment systems like COMPAS do not use race-related data but do incorporate proxies.
The question of whether it is fair to consider racial information, either directly or through proxies, is complicated by the potential tension between accuracy and neutrality. The lead designer of COMPAS, Tim Brennan, is quoted in the ProPublica article saying, “If [proxies] are omitted from your risk assessment, accuracy goes down.” This finding was apparent well before the use of computerized criminal sentencing algorithms: For instance, a 1987 study in the journal Crime and Justice that examined the factors considered by state sentencing guidelines found that “including racially correlated factors increased predictive accuracy [by] 5–12 percent.”
A recent study distills the problem. In a January 2018 article in the journal Science Advances questioning the complexity of COMPAS’s algorithm, two Dartmouth College computer scientists claimed to yield predictive success rates “nearly equivalent to COMPAS” by using only two factors: age of the defendant and number of previous convictions. Race was not explicitly one of the factors — though it is almost certainly correlated with number of previous convictions.
Which brings us to the root of the problem: Racism may well be a significant factor in the higher arrest and conviction rates among black people to begin with. And because of this, racial proxies are a double-edged sword: They can bolster algorithmic accuracy, but only at the cost of validating and perpetuating the vicious cycle in which our justice system’s propensity to disproportionately arrest and incarcerate black people fuels the disproportionate arrest and incarceration of black people. In this light, the fairness paradox is cold comfort, since it doesn’t absolve us of the charge that including racial proxies amounts — in effect, if not necessarily intent — to judging people by the color of their skin.
Following these arguments to their logical conclusion has led some scholars, such as Yale law professor Ian Ayres, to the seemingly counterintuitive suggestion that, if we are truly interested in designing systems that judge only the content of our characters, then in some situations we are actually obligated to consider race or racial proxy data, for the express purpose of combating systemic bias or prejudice.
Regardless, it’s clear that the origin of the underlying data is of critical significance. When COMPAS produces discriminatory outcomes, they’re the result of a systematic application of mathematics that does not consciously take account of race. If two particular defendants present the algorithm with identical characteristics, the algorithm will return identical results, regardless of their race. The algorithm might not, in sum, be racially neutral — since the inputs include information that is correlated with race — but that’s a long way from the algorithm itself being racist.
Likewise, none of those Google autocomplete mishaps would have ever happened without countless racially charged queries from previous users. FaceApp — the viral app that caused an uproar by suggesting that its users would be physically more attractive with European facial features — has a similar story. The algorithm undoubtedly produced racially biased outputs, but it’s not as though it was coded by a coterie of bigots bent on advancing the Aryan agenda. (Though it’s admittedly more challenging to justify FaceApp’s subsequent and similarly ill-fated extension, which applied “ethnicity change” filters — black, white, Asian, or Indian — to user photographs.) Its creators probably had no motivation at all besides writing functional software.
FaceApp’s tepid response to the online furor surrounding the “hot” filter refused to characterize its misstep as anything more specific than “an unfortunate side-effect of the underlying neural network caused by the training set bias.” But even that anodyne choice of words was telling. Neural networks often learn by mimicry. The network is shown thousands of examples of a subject, then asked to identify their commonalities. Machine-learning scientists write this kind of software all the time. But the information that’s fed into the neural network has to come from somewhere — probably either publicly available or crowdsourced data sets.
So when FaceApp tells us that its algorithm was felled by a “training set bias,” they’re essentially shifting the blame to the data. Database bias is a persistent problem for machine-learning programmers. For example, a team of researchers at the University of Massachusetts released a facial recognition system that turned out to be able to identify adults but not children, apparently because the data set it trained on didn’t include any pictures of children. In other words, the data was biased toward adults. Similarly, the creators of FaceApp suggest that their data set was biased toward white features — and that their neural network simply ferreted out a correlation between those features and ratings of attractiveness that was already present in the underlying data. The bias may belong to the data rather than the algorithm, but the equation still holds firm: racism in, racism out.
Unlike the old man’s view of Kileken, the algorithms that run our lives aren’t, and shouldn’t be, regarded as an unalloyed good. But even though we occasionally encounter instances of companies using algorithms to do things like inflate car insurance prices for poor people or dictate the ethnicity of the people who see your online dating profile, dishonorable intentions usually aren’t the issue. Instead, we seem to have a baseline discomfort with ceding complex decision-making to machines — or even with allowing algorithms to aid human judgment — which stems at least partly from a fear that these systems will produce biased outcomes.
This discomfort is curious, because the alternative seems just as troublesome. Human-based decision processes are hardly free of discriminatory bias. In fact, there is a wealth of data showing that people of all backgrounds and levels of expertise regularly display unconscious bias; Malcolm Gladwell spent the better part of his 2005 book Blink taking a deep dive into the matter. Countless studies have shown that human decision-makers who control everything from credit applications to job callbacks display racial bias when presented with race-related or race-proxy information.
But these sorts of biases are unlikely to be hardcoded into an algorithm. For one thing, best practices among today’s programmers require them to include comments specifying the purpose of each command, and an algorithm with a comment saying something like “this section is to ensure that black defendants have worse recidivism scores” wouldn’t withstand even cursory scrutiny. And at the risk of giving large corporate enterprises too much credit, it’s hard to imagine that they would risk their products being associated with overt discrimination. We might not be naturally comfortable with algorithms guiding our decisions, but we also shouldn’t forget that these systems are probably less susceptible to bias than our own flawed minds.
The antediluvian response to our discomfort with algorithms would be to insist that we roll back their influence in our society, or at least curb their use in delicate domains like parole and sentencing determinations. But that response is as misguided as it is naïve. These algorithms are deeply ingrained in our lives and embedded in the strategic visions of cutting-edge industries. Google isn’t going to stop tailoring ads to your search results, auto companies aren’t going to stop developing self-driving cars, and Netflix isn’t going to stop trying to figure out what movie you might want to watch next.
The use of algorithmic decision-assistance tools in our courtrooms has probably crossed that Rubicon as well. Despite still being in the early stages of development — and in the absence of definitive assessment of their performance — tools like COMPAS have already been adopted by jurisdictions all over the country. But their staying power will likely have less to do with widespread early adoption than it will with comparison to the alternative. The law professor Frank Pasquale and many others have described algorithms as black boxes: We can see what goes in and what comes out, but we have only a vague sense of what happens inside. The metaphor is so powerful, in fact, that it makes it easy to forget that the algorithms are replacing (or at least augmenting) the ultimate black box: the human mind. The difference is that, compared to the computerized algorithm, the black box of the mind is less consistent, perhaps even less transparent, subject to a wider and more insidious set of biases, and less adept at managing complexity. Turning the clock back to the days of analog wouldn’t even assuage concerns about the inscrutability of the decision-making algorithms, since doing so would leave judges alone to wrestle with, for instance, the Federal Sentencing Guidelines — which currently check in at 628 borderline-impenetrable pages.
A better starting point for addressing our anxiety about algorithms might be simply to acknowledge that we fear what we don’t understand. The secret sauce comprising any algorithm of even marginal importance in our lives is regarded by its owner as a priceless trade secret, and surely guarded by a phalanx of well-compensated lawyers. This setup keeps companies’ intellectual property shielded from aggressive would-be competitors, but also prevents users and even the legal system from examining how these algorithms work. The information necessary to truly understand many important algorithms just isn’t available to most of us.
But even if that information were available, the apparent complexity of many of these systems makes it likely that very few people would be able to understand what they were looking at. It’s not entirely clear, for instance, how many of Google’s engineers have a comprehensive understanding of its page-ranking algorithm. And if that weren’t enough, algorithms are increasingly availing themselves of machine learning techniques, where the algorithm itself evolves in response to feedback from its earlier inputs and outputs. It’s difficult to comprehend how these algorithms function at any given moment — and impossible to forecast how they will act in the future. We fear what we can’t conquer.
Still, it’s easy to see why those discomfited by these algorithms frequently suggest transparency as a panacea. The results of the COMPAS algorithm, for example, might be less objectionable if we could see exactly why it made a given decision and if defense lawyers had the opportunity to question its reasoning. Sunlight, the argument goes, is the best disinfectant.
But it’s far from obvious that sunlight is what our algorithms need. For one, it’s important not to conflate transparency with reduced complexity — again, the algorithms that run our world are in many cases too complex for most of us to comprehend, and exposing the code underlying these systems wouldn’t change that. And, of course, we’ve determined that it’s not the algorithms themselves that are responsible for racist or biased results; their outputs are simply a reflection of the data they receive.
More than that, the algorithms that we’re discussing have, by and large, been created by profit-seeking enterprises with an existential dependence on intellectual property protections, so weakening these laws in order to make them more transparent might have the perverse effect of discouraging the competition that drives the creation of new and improved algorithms. Worse yet, forced transparency of the inner workings of, say, Google’s page ranking or Facebook’s News Feed would inevitably empower a suite of bad actors — hackers, trolls, and other thieves in the public commons — to try to game the system by tailoring content directly to the algorithms’ specifications. The disinfectant might end up poisoning the well.
Calls for transparency in algorithmic design aren’t principally driven by unmanageable curiosity. Rather, the problem is that we’re uncomfortable that these systems can produce discriminatory results. But, again, the source of the problem is not likely to be the algorithms themselves but instead that the data fed into them often reflects injustices and imbalances that already exist in our world.
Questions of quantifying and combating discriminatory bias are, obviously, not unique to the realm of algorithm design. In constitutional law, for example, this debate manifests in the tension between disparate treatment and disparate impact. Disparate treatment means that the rule in question treats two classes of people differently. The landmark cases involve employment and housing policies, but regulations governing algorithms might have to withstand similar scrutiny. Disparate impact, on the other hand, means that two classes experience unequal outcomes even when treated on a seemingly equal basis.
Both concepts are part of the law of the land. But the standards they imply differ substantially. One dissimilarity is that, in order to prove that some policy violates the disparate treatment doctrine, a plaintiff must prove discriminatory motive or intent, whereas a disparate impact claim need only demonstrate a disproportionate effect on a protected class. These represent different definitions of fairness, and, as we know well by now, selecting the right one is always a vexing problem.
Nevertheless, since discriminatory motive is exceedingly unlikely to work its way into algorithmic code, disparate treatment isn’t especially relevant to the world of algorithms. Disparate impact is the standard we need. Not only does the doctrine rest in large part on the idea that facially neutral rules can and do produce non-neutral results, but it’s also adept at identifying the particular problem, endemic to the fairness paradox, of existing systemic inequities being perpetuated through nominally fair decisions.
But disparate impacts are tough to eradicate. Mandated transparency doesn’t seem to be the answer. Taking a look inside the black box could reassure us that the algorithm is processing data in an even-handed manner, but would do nothing to guarantee that the data that enters or leaves is itself even-handed — which is the assurance that we actually seek. We’d like to know that our algorithms aren’t just reinforcing existing prejudices and entrenching existing inequalities.
In other contexts, we have had at least some success in acknowledging that disparate impacts have deep-seated causes and that we should take deliberate steps toward resolving the resulting inequities. This concept was elegantly championed by Anupam Chander, a UC Davis law professor, in a 2017 law review article titled “The Racist Algorithm?” In Chander’s view, the goal should not necessarily be to root out the source of the discrimination, especially since the complexity of many algorithms would render this attempt futile. Rather, he argues, the aim should be to do what we can to keep this discrimination from being perpetuated.
For some algorithms, this may mean doing what COMPAS already does: excluding race-related data. Uber, for instance, doesn’t show its drivers race-related or -proxy data — such as the customer’s name, headshot, or destination — until after the driver has accepted the ride. Drivers are thus theoretically unable to discriminate, consciously or unconsciously, against groups of customers.
The results have been mixed. Anecdotally, a number of black writers, including Latoya Peterson of the (now-defunct) blog Racialicious and Clinton Yates of the Washington Post, initially welcomed Uber, claiming they have a much easier time getting an Uber than hailing a taxi. And Uber itself claims to have dramatically decreased average wait times versus taxis in neighborhoods with large minority populations. However, Uber drivers still have the option to cancel a ride after they have accepted it, and a 2016 working paper for the National Bureau of Economic Research found that “the cancellation rate for African American sounding names was more than twice as frequent compared to white sounding names.”
In the case of COMPAS and other risk-assessment algorithmic tools, one alternative might be to exclude not only race-related data — as COMPAS already does — but also some racial proxies, such as particular subsets of previous arrests, that hew closer to race-related than race-neutral. As we discovered earlier, though, excluding racial proxies would likely mean reducing the accuracy of the prediction.
Another option would be for COMPAS to take on the problem of disparate impact more directly, perhaps by recognizing the immutability of the fairness paradox, openly engaging with the question of which measures of fairness should matter most, and adjusting its predictions accordingly. The different definitions of fairness that we’ve considered — equal precision or false discovery rates, equal false positive rates, and equal false negative rates — are all interrelated, and all impacted by the base rate of recidivism. That rate is baked into the data, so there is nothing the algorithm can do about it. But we still have the option of equalizing one or even two of these other measures — at the unavoidable cost of more inequity elsewhere.
Entrusting delicate moral judgments to private profit-driven enterprises like Northpointe seems needlessly antidemocratic, so we’re probably better off tasking public policy–making mechanisms with sorting out the relative detriment of the various types of unfairness. Either way, to keep things on the level — and to evaluate whether we are actually achieving what we set out to do — an independent arbitration or adjudication process should certainly accompany any such effort, particularly so long as we are relying on proprietary algorithms to actually implement the balance we’ve specified.
Some of the kinds of policies I’m discussing here — particularly that of deliberately adjusting sentencing algorithms to offset the difference in recidivism rates — resemble what’s commonly known as affirmative action. But the fairness paradox forces us to change the way we think about affirmative action, at least for algorithms. The term “affirmative action” implies adopting some racial preference, which in turn suggests that there’s an option we could choose that doesn’t favor one race or another. In this case, there isn’t. The burden of the fairness paradox is that, so long as there are racial disparities in the underlying data, there is no possible algorithm that will be neutral in every sense. Every version of the algorithm exhibits a preference. The only way to achieve true racial neutrality for sentencing algorithms would be to exclude all racial proxies, which would likely render them next to useless.
We’re left with a Hobson’s choice, like the stark take-it-or-leave-it proposition of the livery stable owner who told customers they could either buy the horse nearest the door or get out: accept a non-neutral algorithm, or nothing at all. But make no mistake. Abandoning sentencing algorithms would both fail to place defendants on an even playing field and also create a new unfairness by sacrificing the social good of alternatives to incarceration for defendants we have reason to believe are not likely to re-offend. It’s hard to see the upside.
We can’t escape the imperative to strike some balance or another between our different senses of fairness. Fortunately for us, the fairness paradox can be a guidebook showing us how we can realize the standards of fairness that we deem most important. If we let it.
There is controversy in contemporary jurisprudence over how to address the ongoing effects of our society’s discriminatory antecedents. The more conservative approach is to suggest that the way to stop being racist is just to stop being racist — that is, to bar any effort to advance the interests of one group over another. I fear that this approach is overly optimistic: if nothing else, we’ve seen that, as long as the forces of systemic discrimination remain, justice cannot be blind.
Our first steps into the brave new world of algorithmic design are threatened by a reliance on data that would keep us tethered to our discriminatory past. We need to find a way to break free. Otherwise, like the old man, we risk sabotaging our own future.
April 24, 2018